QInsight: A Secure, Comprehensive, Clinical Trial Data Visualization Solution
Tackle Data Visualization Challenges to Drive Informed, Data-driven Decisions
Organizations face significant challenges in advanced data visualization, including data overload, lack of customization, and difficulties in interpreting complex datasets. These issues can hinder effective decision-making. Additionally, integrating diverse data sources while ensuring data quality and compliance remains a persistent hurdle.
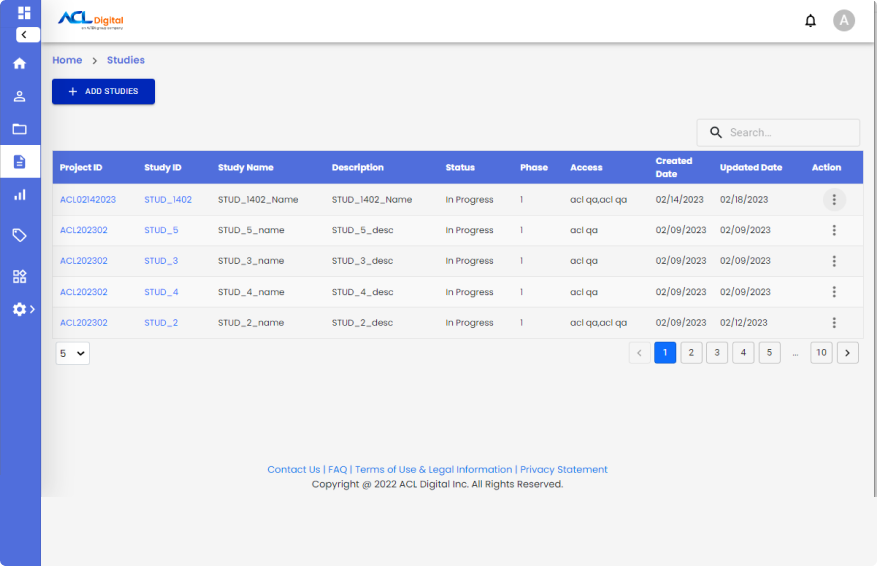
ACL Digital’s QInsight is an advanced data visualization service tailored to pharmaceutical companies’ various clinical requirements. It offers an interactive, secure, innovative dashboard with advanced built-in analytics. It provides real-time insights and dynamic visualizations. Our teams create compelling dashboards and comprehensive reports, allowing you to monitor and analyze clinical trial data precisely.
QInsight’s Unique Features Helps Streamline Your Research
Multiple Plugin Input Data Streams
We integrate diverse data formats like CDISC, SDTM, ADaM, ADS, Excel, .csv, and .dat for seamless collaboration and efficient data import.
Data-Friendly Platform
We offer intuitive web-based platforms with features like subgroup filtering, instant data insights, and simplified exploration.
Multi-Panel Display
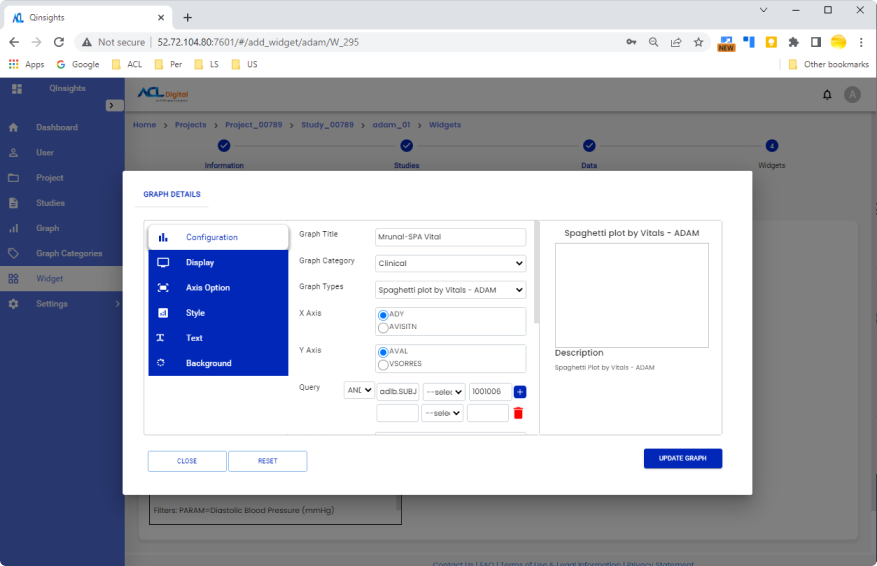
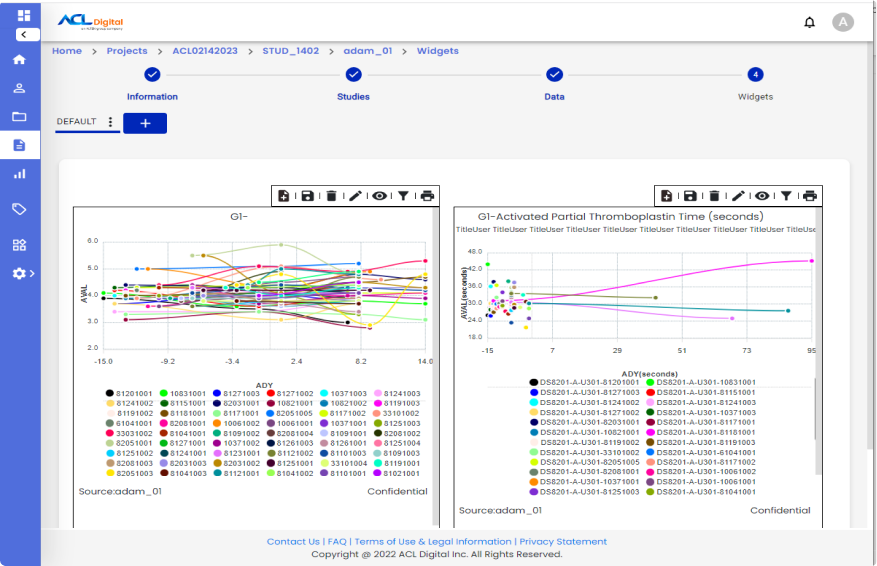
We customize data visualization with intuitive, drag-and-drop GUI that enables dynamic multi-panel displays, customizable widgets, and easy configuration.
Custom Widgets
We create and manage customizable widgets for flexible data visualization and private insights, simplifying visualization management through an intuitive portal.
Compliance and Audit Transparency
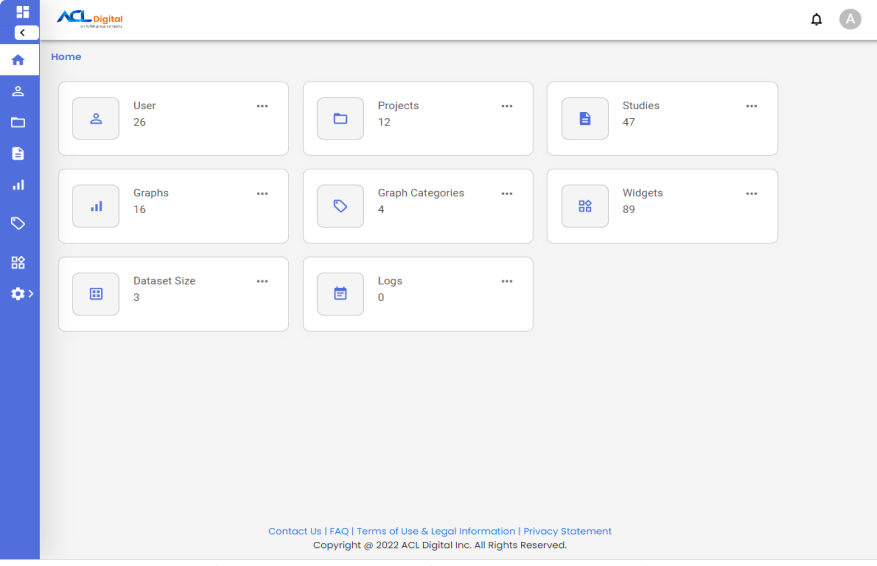
We maintain audit trails and ensure regulatory compliance with documented logs, enhancing data integrity, security, and transparency.
Useful Visualizations
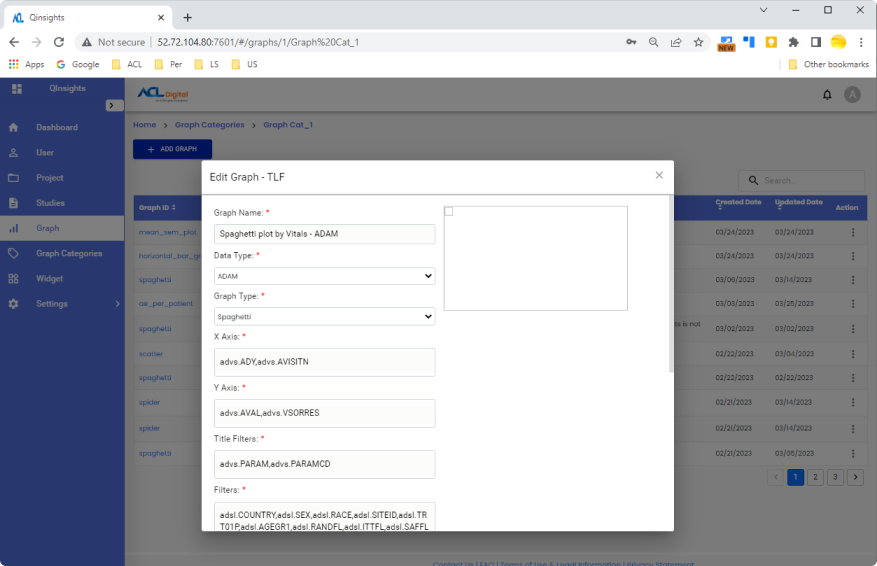
We provide a library of pre-built clinical trial graphs to accelerate reporting and improve data visualization, reducing the need for custom coding.
In-Built Advanced Analytics
We help you unlock powerful insights with interactive dashboards and advanced analytics, supporting detailed clinical trial analysis and decision-making.
Continuous Improvement
We provide regular updates with new features and data connectors (SEND, NIH, clinicaltrials.gov) to keep the platform aligned with industry trends and user needs.
Negate Data Silos
We improve team collaboration by providing full access to study data, breaking down data silos, and reducing dependency on specialized teams.
Access Powerful Technologies
We leverage AI/ML to enhance data processing, enabling advanced analytics for deeper insights into complex datasets.
Empowering Clinical Research with the Benefits of QInsight

Enhanced Security System
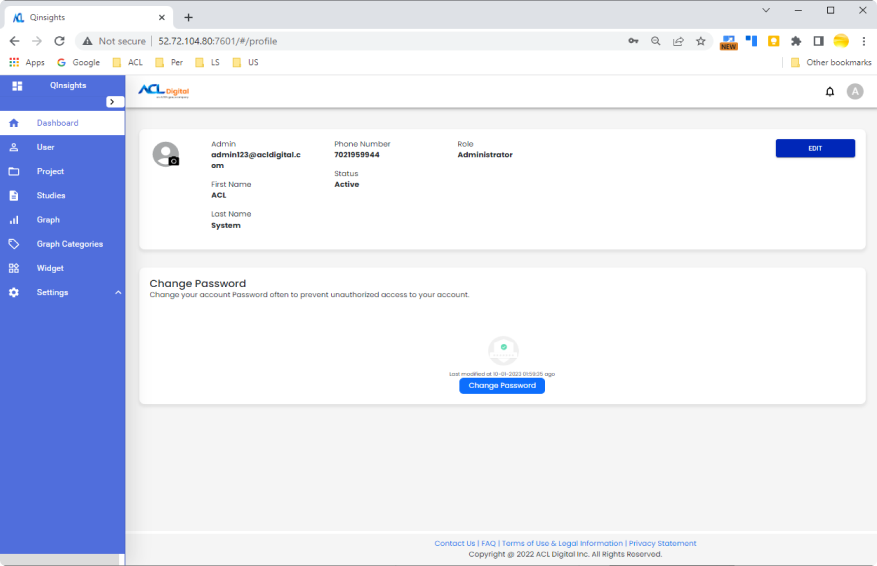
Safeguard your data with advanced security measures like role-based access and password-protected downloads while ensuring compliance with regulatory audits. Customize user access and restrict output types to enhance your security needs.
Cost Savings
Leverage innovative solutions offering substantial savings at no extra fees for software licenses, upfront payments, or setup, eliminating the need for specialized manpower and simplifying the implementation process.
Fast User Adoption
Accelerate your team’s productivity with our user-friendly, plug-and-play systems, which provide a streamlined onboarding process to quickly integrate users, allowing them to become proficient and productive in no time.
Quick Deployment
Experience a smooth and efficient deployment with our hassle-free solution, designed for rapid implementation to ensure a swift setup so you can start benefiting from our system without unnecessary delays.

The Interactive and Insightful Dashboard Comes with Ready-to-use Intuitive Features with Minimum Learning Curve
